Wake up daily to our latest coverage of business done better, directly in your inbox.
Get your weekly dose of analysis on rising corporate activism.
The best of solutions journalism in the sustainability space, published monthly.
Select Newsletter
By signing up you agree to our privacy policy. You can opt out anytime.

Inequality Shown in 10 Charts: How the System Failed Workers in 2021
It’s clear the pandemic has widened inequality between the haves and the have-nots, and the work of these researchers back up such assumptions with data.

It’s been clear that the two-year-old pandemic has widened inequality between the haves and the have-nots. Yet to really understand what’s happened since early 2020, it’s important to take a look at the 10 graphs that Sarah Anderson and Brian Wakamo recently put together for Inequality.org.
Let’s start with the big numbers. While the combined wealth of the 745 U.S. billionaires surged 70 percent in 2021, and corporate profits increased 50 percent, it was a different story for workers at the bottom of the American pyramid. True, wages went up by 17 percent; but that 8 percent rise in consumer prices took a sizable bite out of any pay increases.
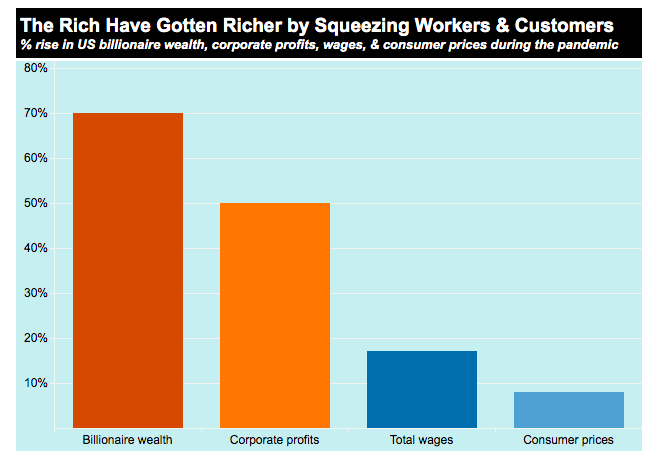
Yet, it’s not a simple case of the rich getting richer and the poor getting poorer. In fact, we can make the case that now, inequality can be traced to the rich squeezing the poorer. The data and facts are there, and companies would be wise to be aware of what’s going on in the U.S. economy before touting their latest “good work” for their employees and communities.
What do we mean? For example, during the third quarter of 2021, corporate profits spiked upward to a record $2.5 billion, largess that largely benefitted these companies’ executives and shareholders. “One factor behind the profits spike: giant corporations have used the excuse of pandemic-related supply chain bottlenecks to jack up prices for gasoline, food, and other essentials,” concluded Anderson and Wakamo.
Editor's note: Be sure to subscribe to our Brands Taking Stands newsletter, which comes out every Wednesday.
The stories out there back up the work of Inequality.org. Check out the summaries of investor calls by America’s largest companies that sell essentials such as food and consumer products.
“A key reason companies are able to succeed with these hikes is that so many of them are doing it,” Dominick Reuter wrote last fall for Business Insider. “If only Unilever charged more, that could drive shoppers to choose an offering from Colgate-Palmolive or P&G. When all of them do it, you don't have a choice.”
It’s true that at a macro level, the U.S. has enjoyed a strong job market. But again, looking beyond the numbers reveals more disparities behind the inequality gap. True, at last check, unemployment has dipped to 4.2 percent, one-third lower than at the beginning of 2021. But while Whites are unemployed at a rate of only 4 percent, the percentage of Blacks who are unemployed is almost double that rate.
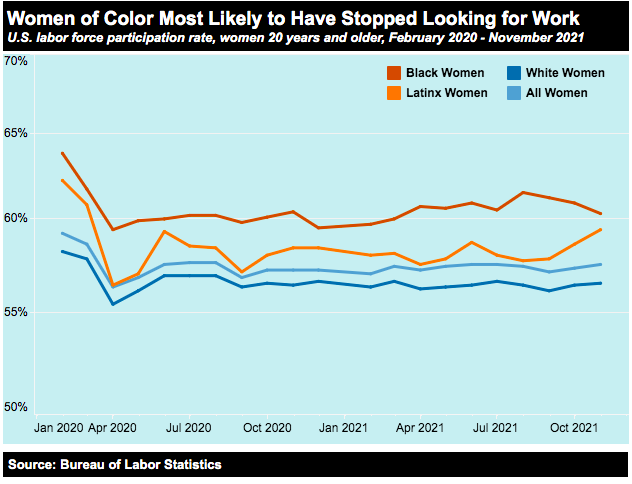
As with any data point, the U.S. unemployment rate at face value doesn’t share some of the more disturbing realities about inequality and the state of the labor market. At least 3.5 million Americans have left the job force for a host of reasons. Black women have faced the steepest drop, as just over 60 percent of them are actively working, a decrease sharper than that of Hispanic and White women.
Going back to those wage increases: Anderson and Wakamo argue that such raises were the results of strikes and other actions that occurred that spurred companies to increase their minimum hourly wages. But considering the $234 billion that companies spent on stock buybacks last year, the results have only led an increase in the pay of executives – not capital investments or wage increases that could have helped narrowed inequality in the U.S. while motivating workers to stay on the job.
Meanwhile, political polarization in Washington has stymied any investments and policies that could have given more citizens in this country a much-needed and deserved break.
Anderson and Wakamo released these charts before it became clear that “Build Back Better” would die on Capitol Hill due to a certain U.S. senator; clearly, they had some hope that 2022 would not be so bleak for America’s wage earners. “While the 2021 debate over spending and tax policies has dragged on too long, it’s encouraging that the central question has been how much revenue to raise from the rich to invest in human needs,” they said. “This represents a long-overdue rejection of the failed ‘trickle down’ theories the wealthy and their advocates in Congress have used to justify tax cuts and other economic policies that benefit the rich at the expense of the rest of us.”
Image credit: Blake Carpenter via Unsplash; graphs courtesy Inequality.org
Leon Kaye has written for 3p since 2010 and become executive editor in 2018. His previous work includes writing for the Guardian as well as other online and print publications. In addition, he's worked in sales executive roles within technology and financial research companies, as well as for a public relations firm, for which he consulted with one of the globe’s leading sustainability initiatives. Currently living in Central California, he’s traveled to 70-plus countries and has lived and worked in South Korea, the United Arab Emirates and Uruguay.
Leon’s an alum of Fresno State, the University of Maryland, Baltimore County and the University of Southern California's Marshall Business School. He enjoys traveling abroad as well as exploring California’s Central Coast and the Sierra Nevadas.


